
News
Madrid launches an urban viewer with 190 indicators to anticipate how its neighbourhoods will change
The Ayuntamiento de Madrid has launched an internal viewer for the Plan Estratégico Municipal that brings together 190 indicators, 134 databases, and 37 sources to assess housing, mobility, green spaces, and services street by street.
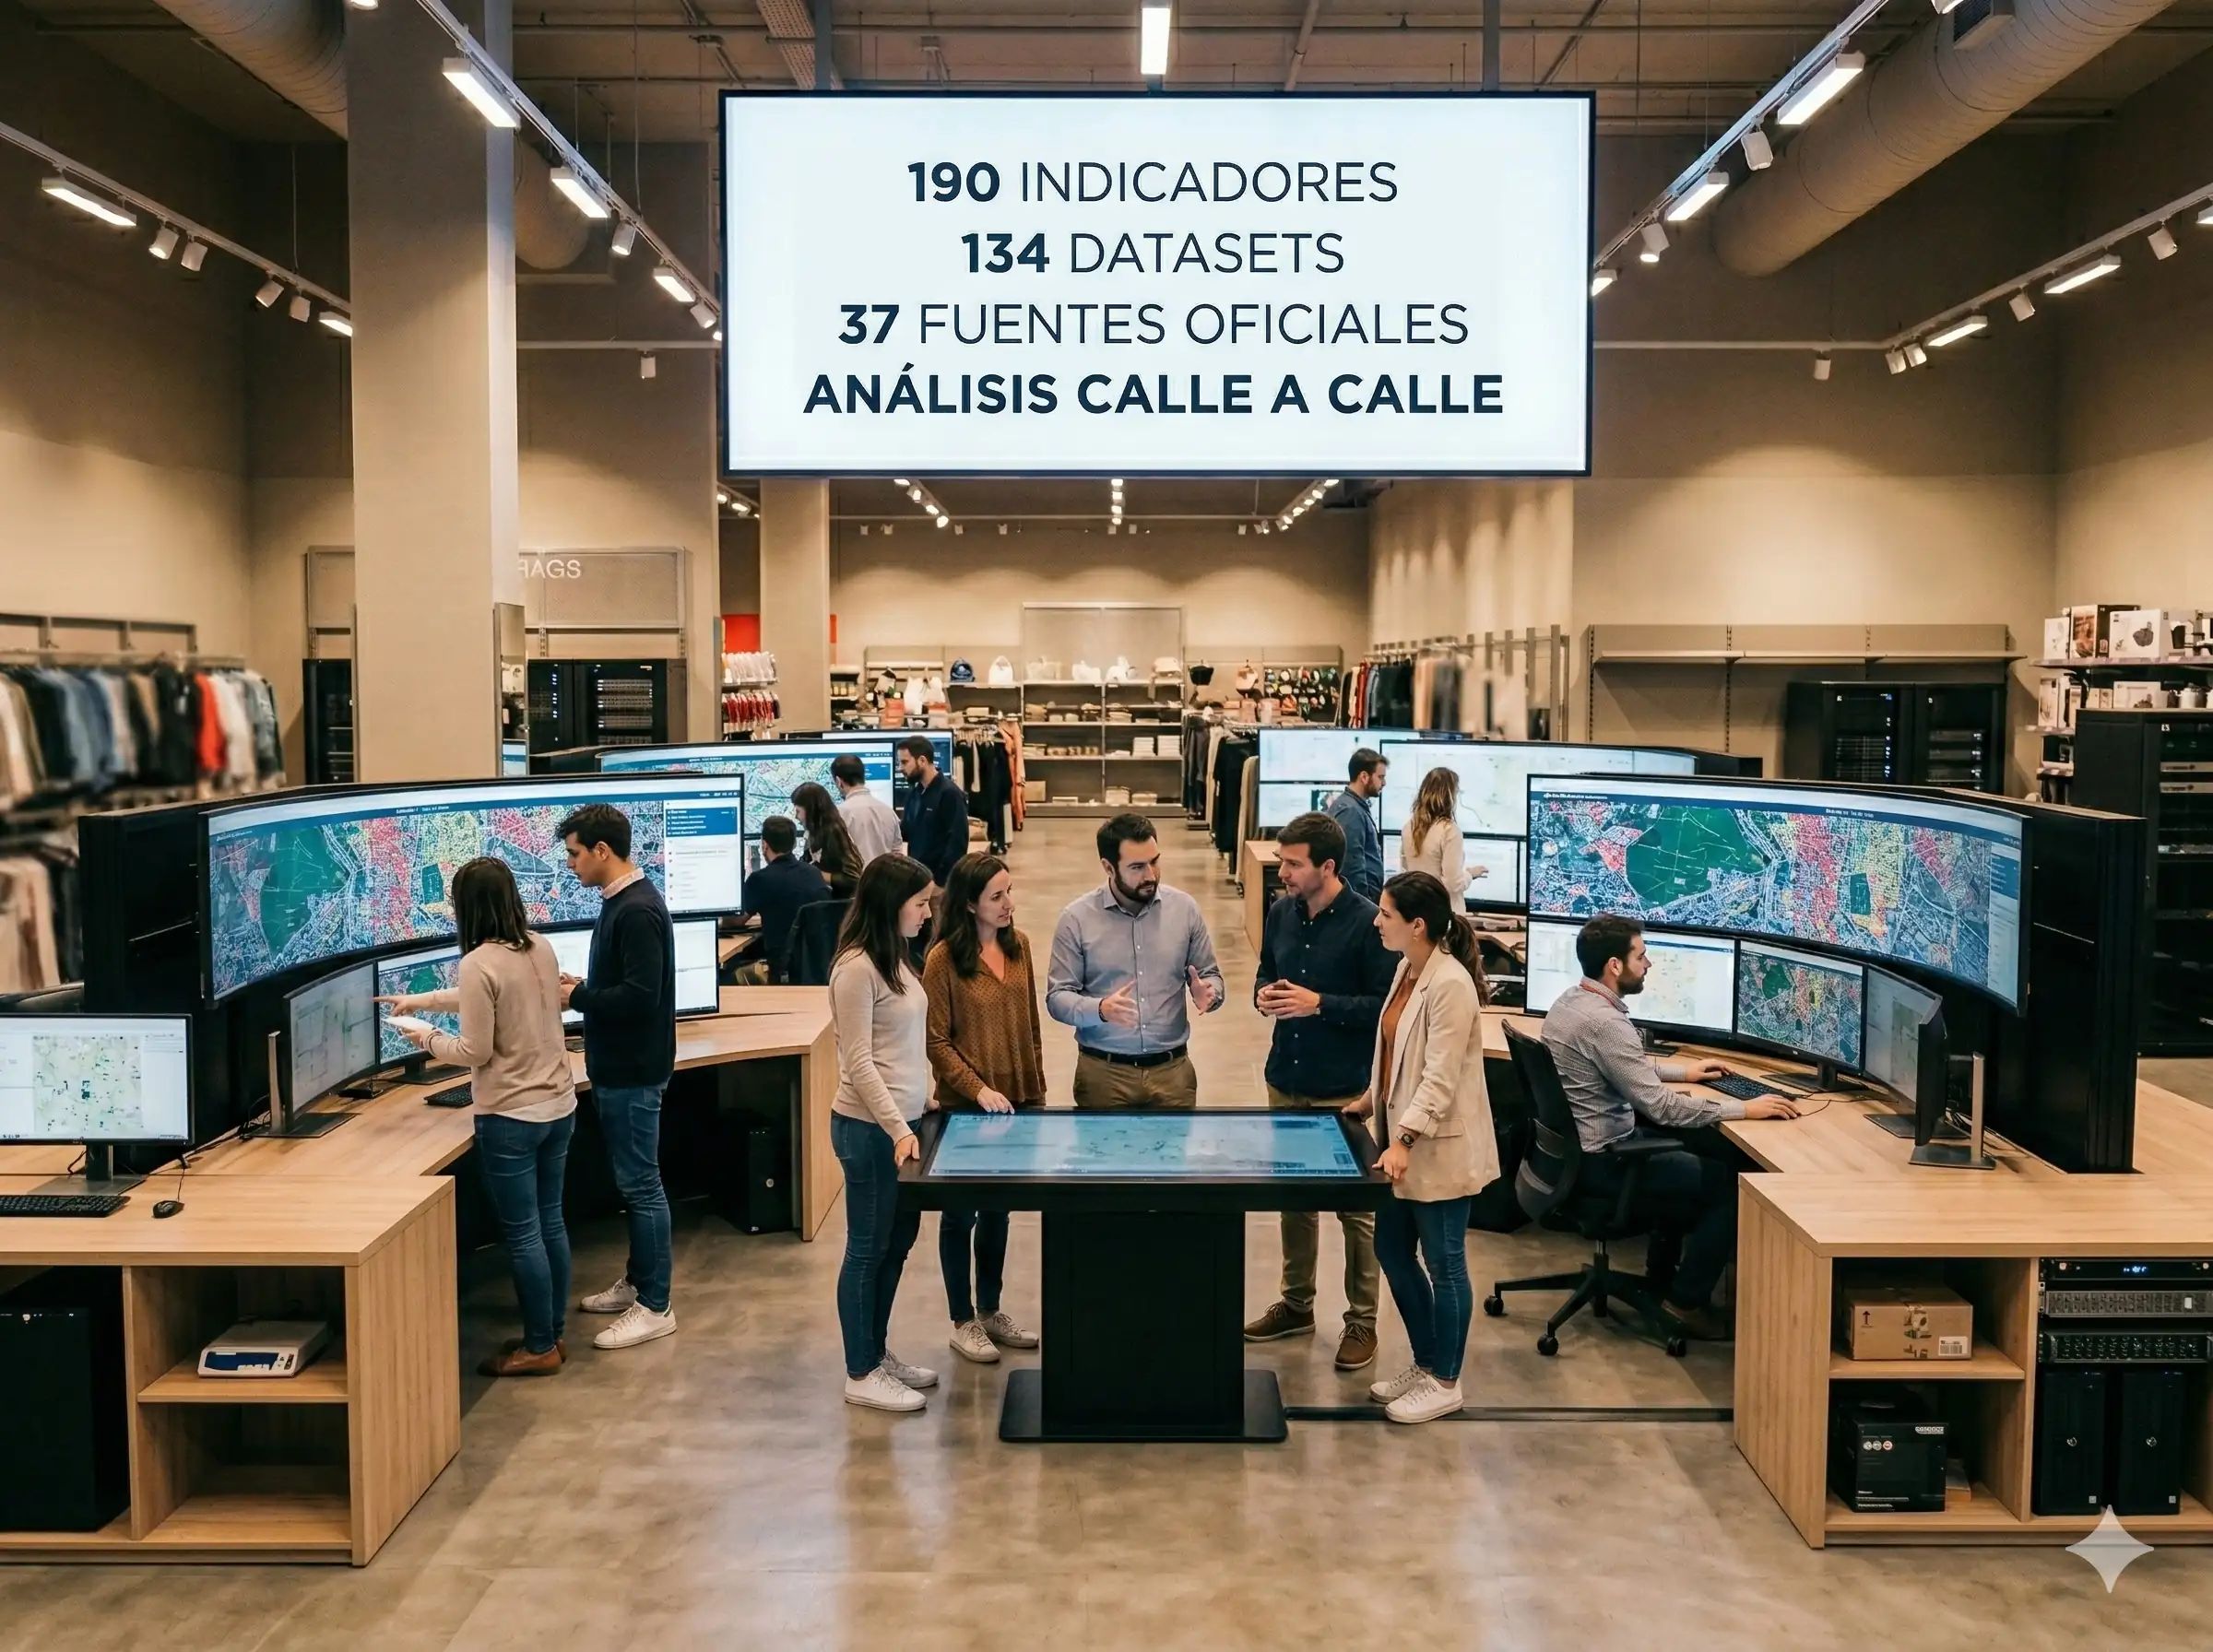
Madrid launches a digital tool that analyses housing, mobility and services data. The viewer makes it possible to anticipate urban changes at street level. It will affect those looking for a home, moving around the city or enjoying its neighbourhoods.
Madrid’s pulse is now measured with data. The City Council has activated a digital viewer that gathers information on housing, mobility, green areas and services, with the aim of anticipating how neighbourhoods and streets will evolve in the coming years. This tool, called the Strategic City Simulator, is already operating internally and allows municipal technicians to analyse everything from the average age of buildings to the floor area of homes or the distribution of public facilities.
Madrid activates the Municipal Strategic Plan Viewer (1st phase of the Strategic City Simulator): 190 indicators/134 datasets/37 sources (INE/cadastre/Canal Isabel II/municipal housing/mobility/demographics/environment/economy). Neighbourhood/block/plot analysis with interactive AI maps; diagnoses 8 challenges (housing/mobility/climate/public space/culture...). Examples: Ciudad U. more facilities; Orcasur healthcare; Hellín residential; Aluche +homes; Sol retail. Next: simulate policy scenarios (phase 2).
1,512,496 households; average 83.44m² (Salamanca 103m²; Puente Vallecas 69m²); 60.65% owner-occupied (Moratalaz leads); Centro +rental housing. Replaces the 1997 General Plan.
The viewer incorporates 190 indicators and 134 datasets from 37 official sources, such as the National Statistics Institute, the cadastre or Canal de Isabel II. For the first time, all this information is cross-referenced on a single platform, making it easier to detect imbalances, anticipate needs and plan urban interventions precisely. The City Council stresses that the tool makes it possible to refine the diagnosis down to block level, something unprecedented in the city until now.
Among the first shared data, it is confirmed that Ciudad Universitaria leads in land allocated to public services and facilities, while Orcasur has more healthcare facilities. The Sol district remains the commercial epicentre. As for housing, Madrid has 1,512,496 households, with an average floor area of 83.44 square metres. Salamanca stands out for the largest homes (103.14 m²) and Puente de Vallecas for the smallest (69 m²). 60.65% of homes are owner-occupied, with Moratalaz at the head, and the Centro district has the highest percentage of rentals.
The tool is part of the first phase of the new Municipal Strategic Plan, which will replace the 1997 General Plan. The aim is to design urban strategies in eight key areas: city model, society, housing, climate neutrality, economy, mobility, public space, and culture and heritage. Once data collection is complete, the City Council will be able to simulate scenarios and anticipate the impact of future decisions, such as prioritising renovations or expanding green areas.
The Strategic City Simulator represents a change in the way Madrid is planned. Until now, data was managed in a scattered and analogue way. With this platform, the city gains in responsiveness and future vision. Madrid is already beginning to move in that direction.
The urban viewer is a commitment to smart city management. Similar tools have been tried in other European capitals, but the scale and level of detail achieved in Madrid make a difference. This digitalisation enables municipal leaders to make more informed decisions tailored to the reality of each neighbourhood, something that can transform the everyday experience of those who live, work or stroll around the city.